Blog · Release · v3.2.0
Scopes are here — Spiralyst Lab v3.2.0.
Four new render types that show you the sound itself, not just react to it. An oscilloscope, an X-Y vectorscope (Lissajous), a frequency spectrum analyzer, and a parametric harmonograph — out now on spiralyst.com.
Spiralyst Lab v3.2.0 is live, and the headline addition is a third category of render type. The 14 two-dimensional and 13 three-dimensional fractals you already know are joined by a new Scopes group: four instrument-style visualizers that draw the sound itself.
For 27 fractals, the audio is fuel — bass drives the zoom, hats shimmer the color, the melody bends the geometry. The picture is art and the sound moves it. Scopes flip that around. They keep the same canvas, the same color and effects controls, the same recording and export, but what they draw is the audio. Its waveform. Its stereo image. Its frequency content. Or the mathematical curve audio could be made to dance.
Oscilloscope — the most direct picture of a sound
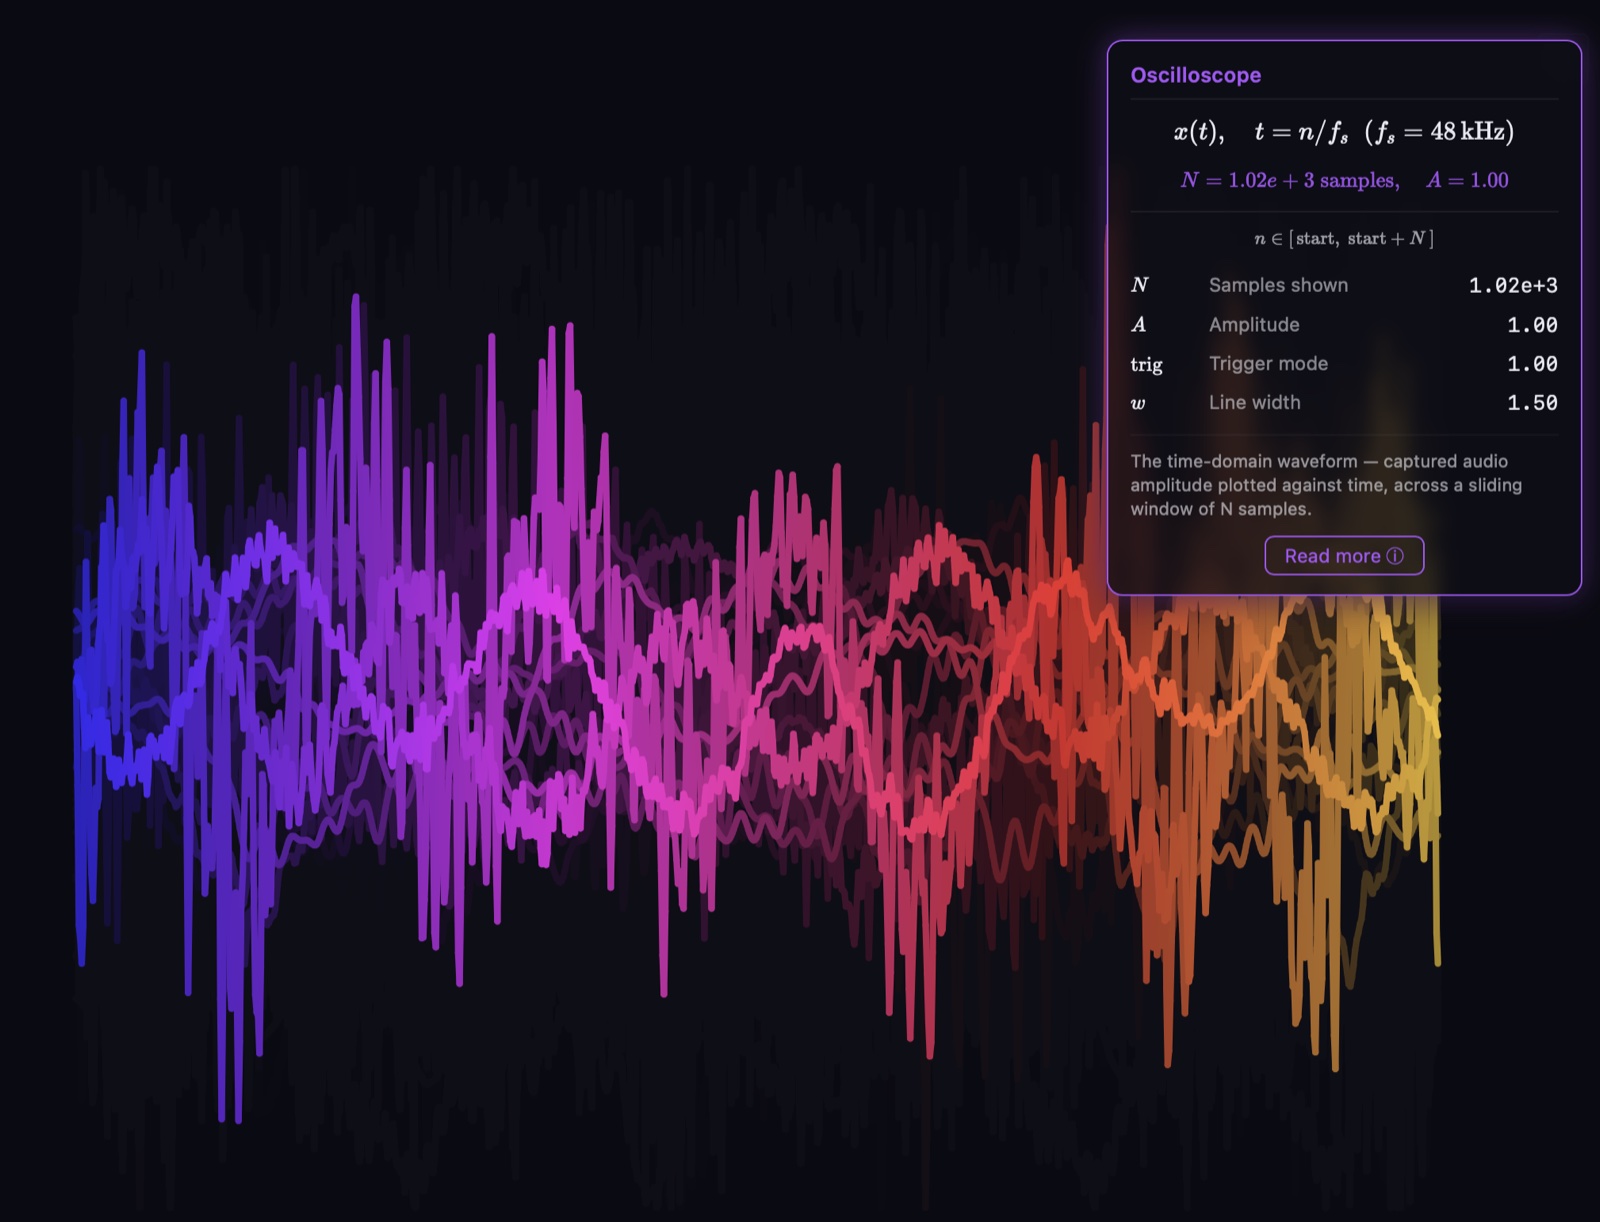
x(t), t = n/fₛ (fₛ = 48 kHz) and the live parameters for Samples,
Amplitude, Trigger mode, and Line width.
Before a sound is pitch, rhythm, or timbre, it is just a wiggling line. The oscilloscope shows you that line directly: time across the screen, amplitude up and down. A pure tone is a clean sine; a rich instrument piles harmonics into a complex repeating shape; a drum hit is a sharp transient that spikes and decays. It's the same instrument every electronics lab uses, and an ECG is essentially one specialised for the heart.
Spiralyst Lab's oscilloscope is a true software oscilloscope of the captured audio, with the controls you'd expect: a triggering option to hold the trace still on a repeatable feature, auto-gain so quiet music still fills the screen, and a samples window that sets how much of the timeline you see at once.
Lissajous (X-Y) — a real vectorscope
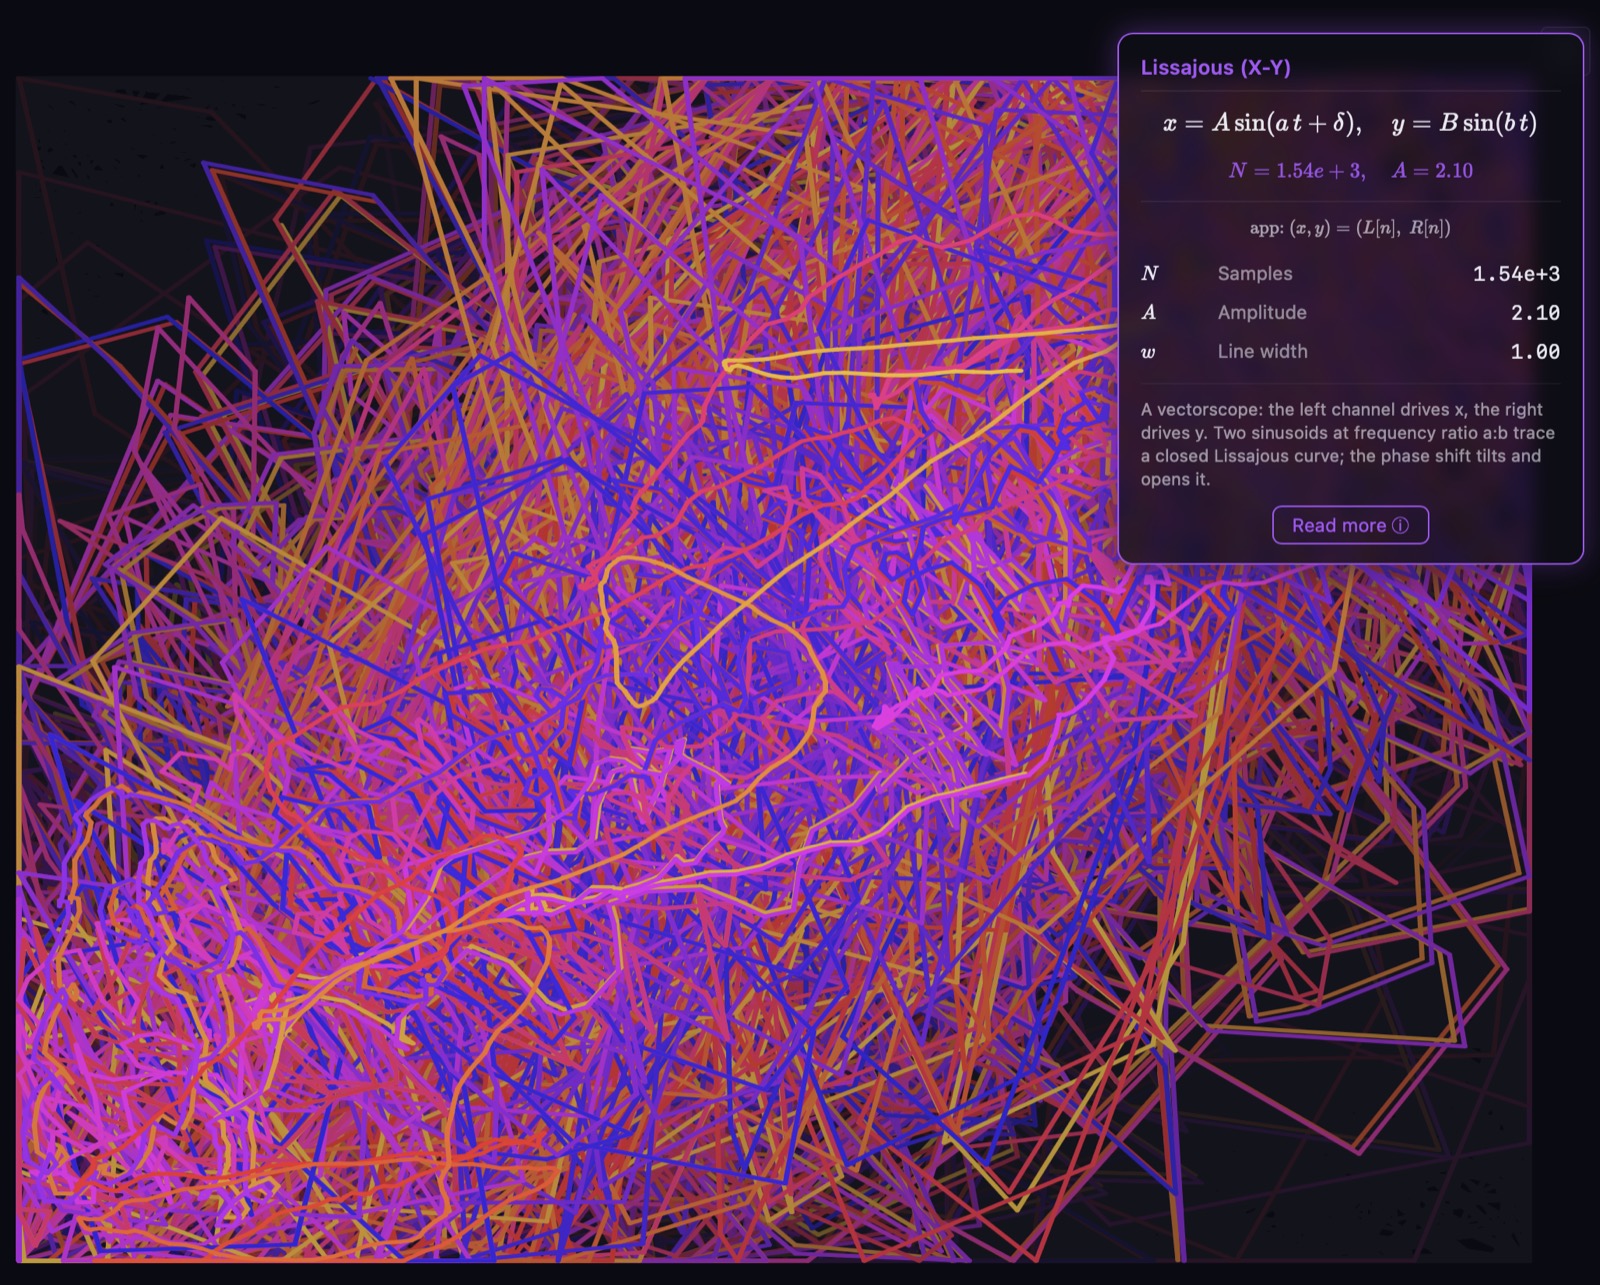
x = A·sin(at + δ), y = B·sin(bt), the app-form note
(x,y) = (L[n], R[n]), and live parameter rows for Samples, Amplitude,
and Line width.
Take away the time axis, plot left audio against right, and the moving dot stops drawing a graph and starts drawing a figure. Jules-Antoine Lissajous studied these curves in 1857 by bouncing light off mirrors mounted on tuning forks. The same patterns show up in any system where two oscillations meet at right angles, and they have a real practical life as the vectorscope: a mono signal collapses to a single diagonal, a wide stereo mix blooms into a cloud, a channel flipped out of phase swings to the opposite diagonal. Useful for mastering, not just decoration.
The X-Y plot is also the canvas for oscilloscope music — an art form where stereo audio is composed so that its left-versus-right plot draws recognisable pictures. The waveform you hear is the picture you see.
Spectrum — every sound broken into colour
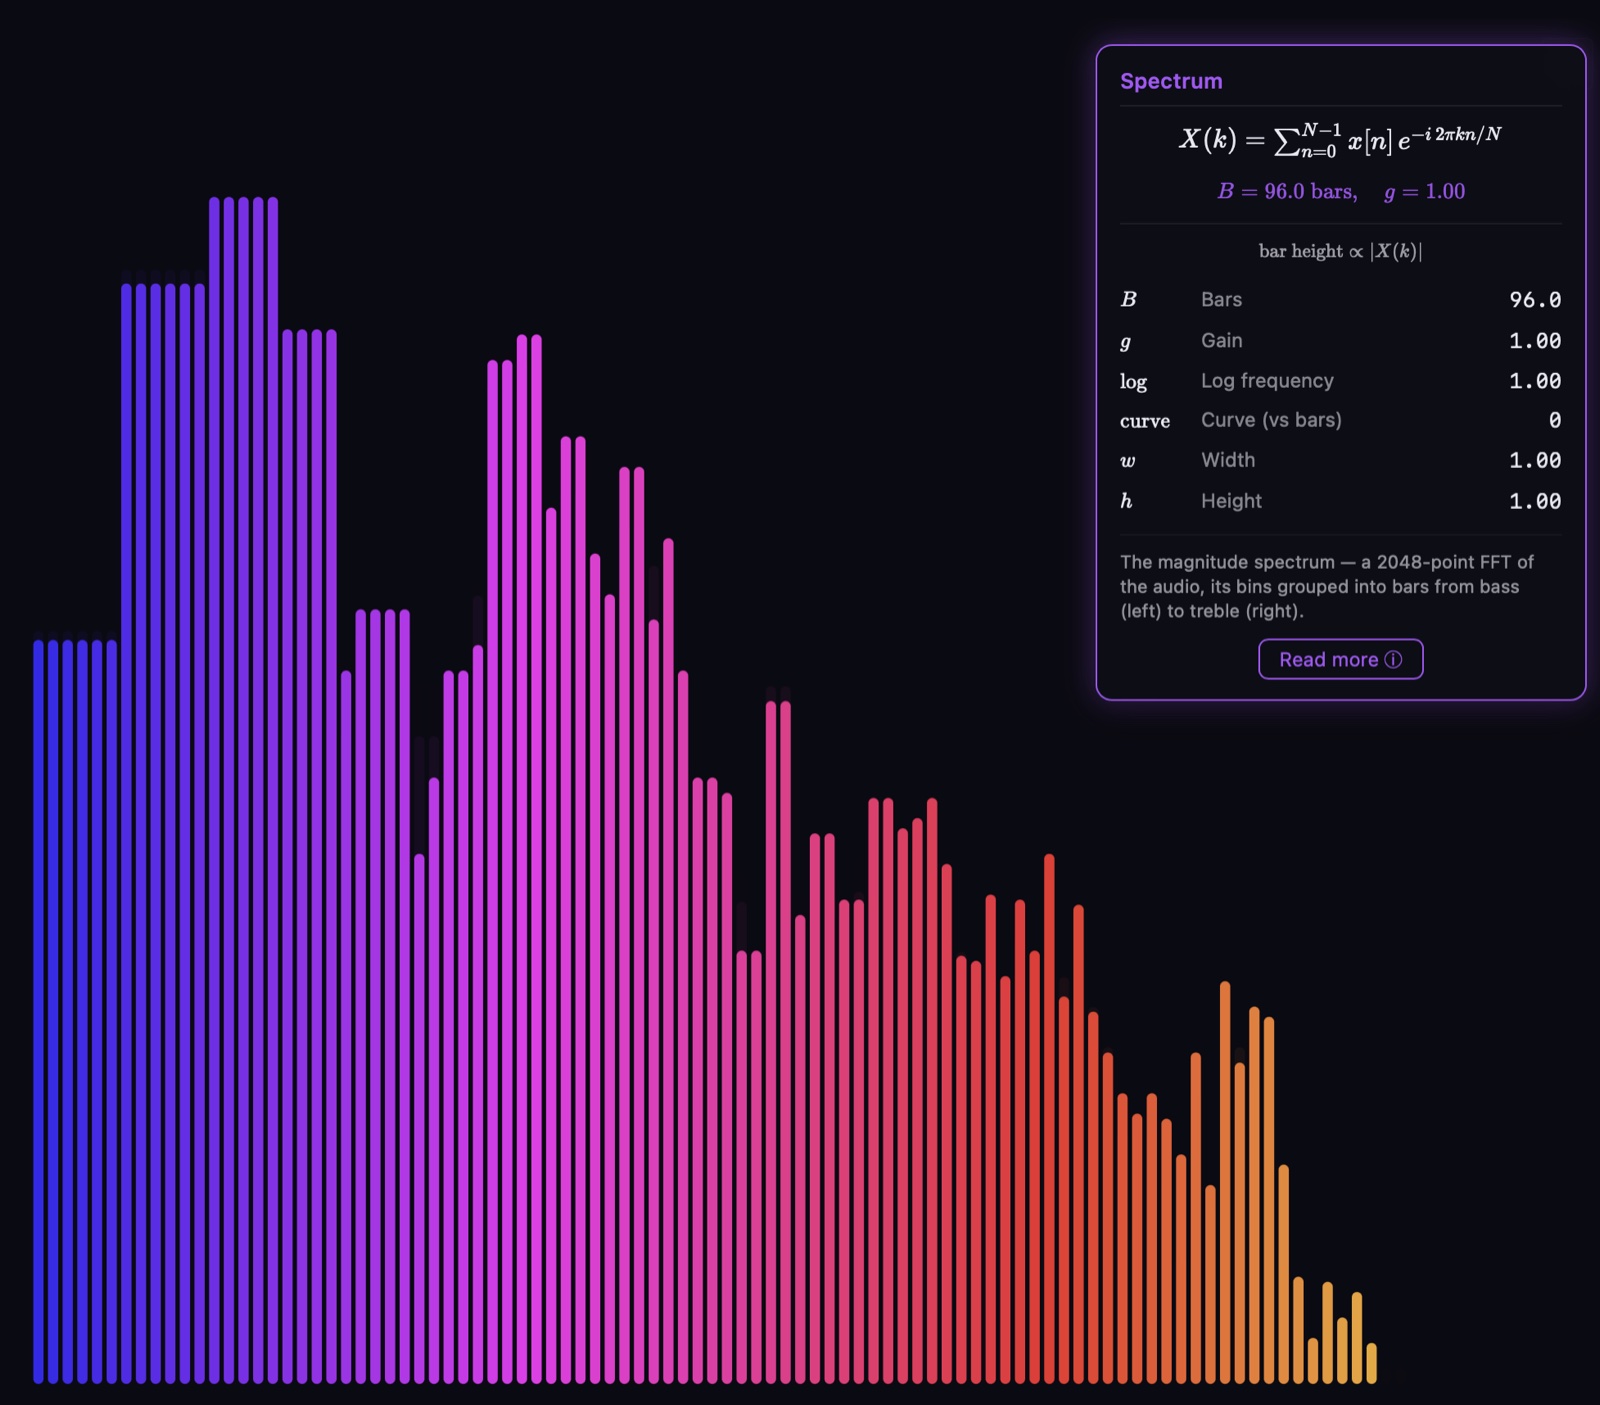
X(k) = Σ x[n] · e^(−i·2πkn/N) with
bar height ∝ |X(k)|, and the per-slider guide for Bars, Gain, Log
frequency, Curve (vs bars), Width, and Height.
Joseph Fourier's idea — that any signal, however complicated, can be rebuilt by adding together pure sine waves — sits underneath every spectrum analyser. The spectrum mode runs that idea in reverse: it measures how much of each frequency is present in the live audio and draws a bar — or a curve — whose height is the energy at that pitch. Deep bass on the left, bright treble on the right.
Your own ear does exactly this. The cochlea is a coiled biological frequency analyser, its hair cells tuned from low pitches at one end to high at the other — so a spectrum display is, in a real sense, a picture of what your hearing is doing. The Fast Fourier Transform that makes the display possible was popularised by Cooley and Tukey in 1965 and is often ranked among the most important algorithms of the twentieth century; it quietly powers MP3 audio, JPEG images, Wi-Fi, and medical imaging. Spiralyst Lab's spectrum mode reuses the same frequency data that drives the audio-reactive fractals — drawn visibly, with no added audio cost.
Harmonograph — the Victorian pendulum's drawing
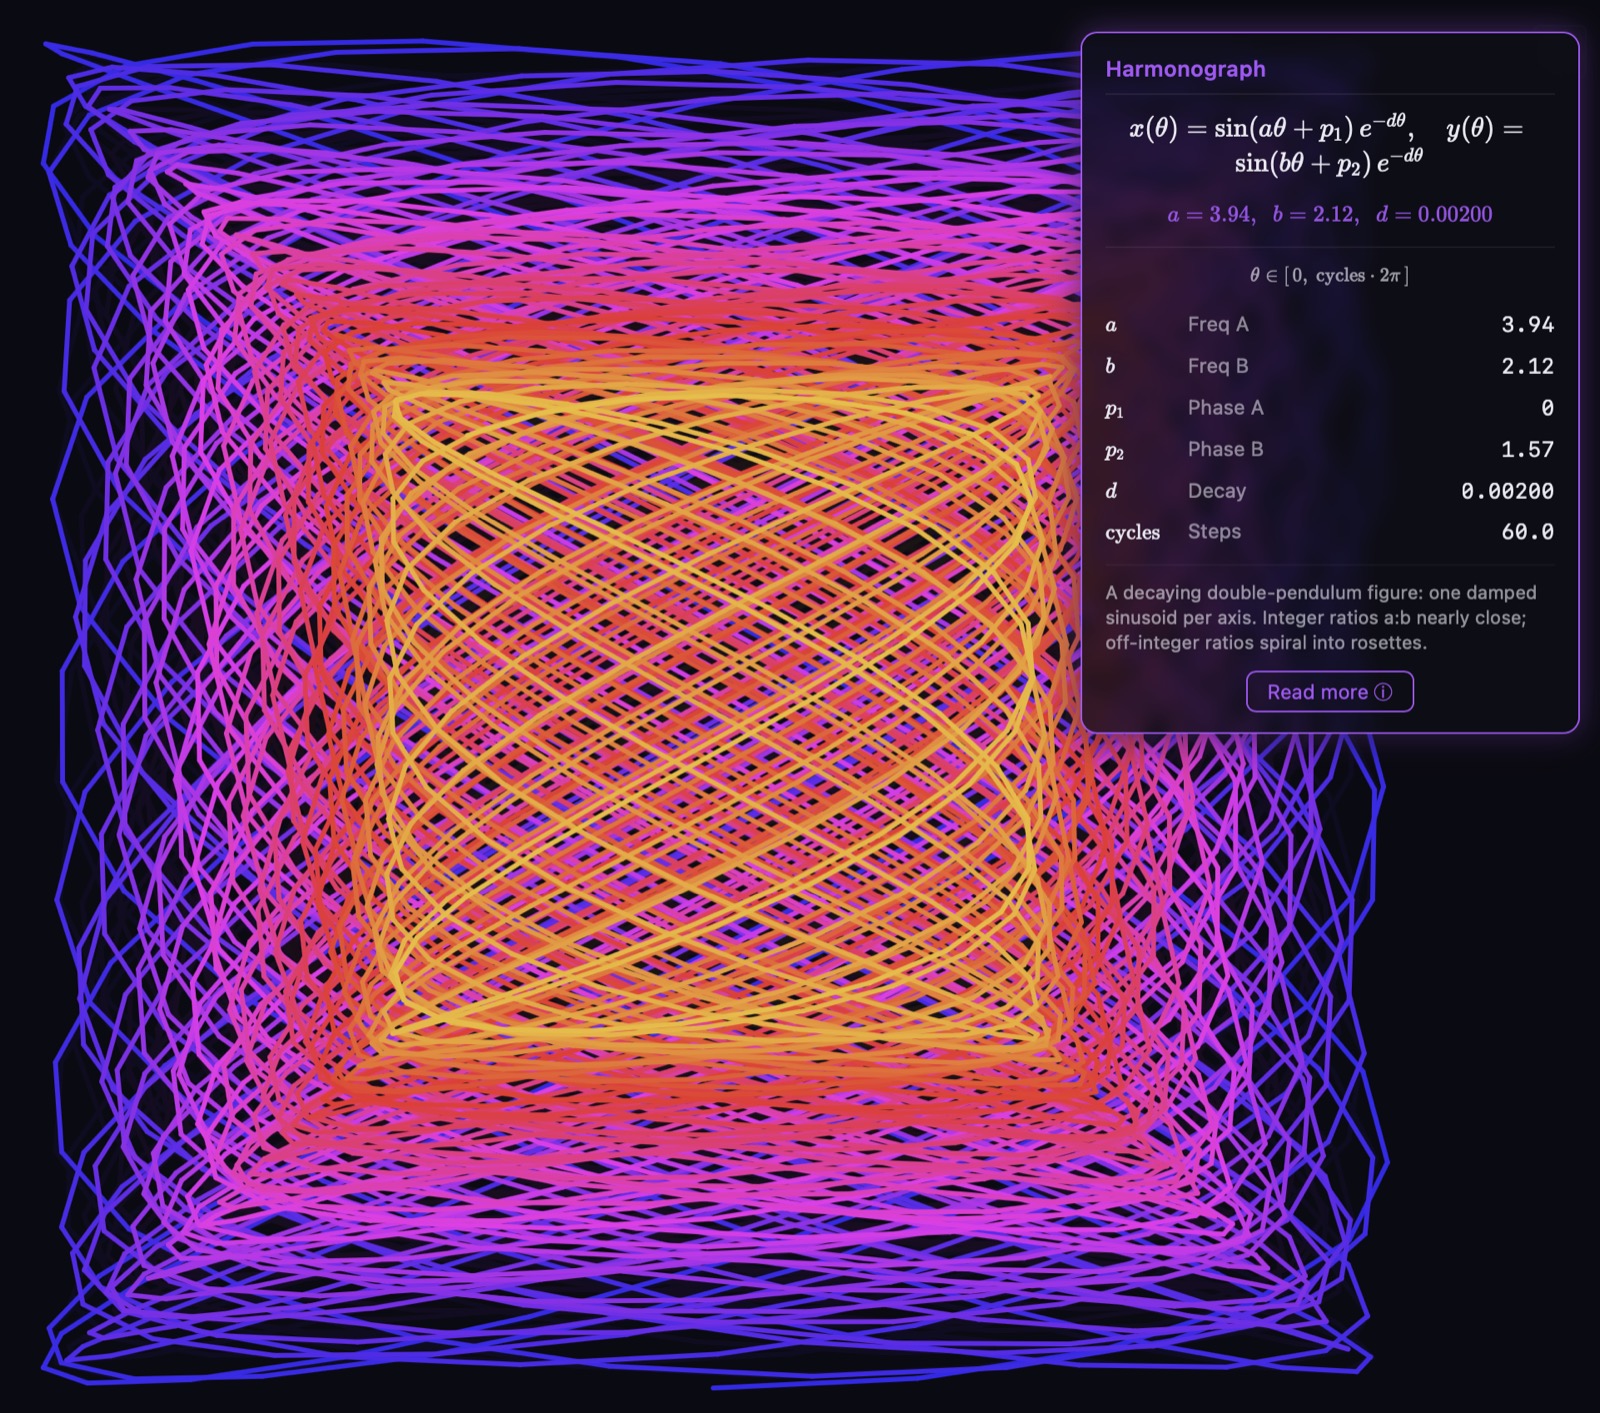
x(θ) = sin(aθ + p₁)·e^(−dθ), y(θ) = sin(bθ + p₂)·e^(−dθ) and live
parameter rows for Freq A, Freq B, Phase A, Phase B, Decay, and Steps.
In the late 1800s the harmonograph was a popular parlor wonder: a table-sized contraption of swinging pendulums linked to a pen, left to draw on its own. Set the pendulums going and the pen wove intricate symmetrical figures; as friction bled the swings of their energy, each loop drew slightly smaller than the last, so the whole pattern spiralled inward to a still point. The spirograph toys many of us grew up with are its geared, pocket-sized descendants — the same mathematics of coupled rotation, captured in plastic gears.
Spiralyst Lab recreates the figure in pure math: a single damped sine wave on each axis — one pendulum per direction, not the multi-pendulum sum of a physical harmonograph. The essential motion is captured, not the physics of the real rig. Like its 19th-century cousin, this one has no microphone in its draw — but every one of its sliders is audio-bindable, so the figure can be made to dance to whatever is playing.
What this means for the studio
Every scope is a first-class render type. They inherit the same color and effects controls as the fractals, the same audio reactivity, the same File → Record Video export. Math Mode covers all four — every scope has a live formula tile, a textbook-depth info card, a hero formula, and a per-slider guide, just like the 27 fractals. The complete catalogue is now 27 fractals plus 4 scopes — every type carries the formula overlay.
For the full walk-through of each mode — including the math, the audience hooks for educators and audio engineers, and a tour of the controls — see the Scopes feature page.
How to get it
New here? Spiralyst Lab is $24.99 for a one-year license, direct download from spiralyst.com. v3.2.0 is what you'll get when you download today.
Already a customer? v3.2.0 is included in your annual license — grab the latest build from spiralyst.com/download and replace your copy.
Get Spiralyst Lab — $24.99/yr See the Scopes feature page ← All posts