Feature guide · Math Mode
Math Mode — see the formula behind every fractal.
A teacher's-tool overlay built into Spiralyst Lab. Toggle it on and the math that draws the picture is right there on the canvas, updating live as you tune the sliders. Built for math educators walking a class through fractal geometry, and for hobbyists who want to see what each parameter actually does.
Why Math Mode exists
Every fractal Spiralyst Lab renders has a real equation behind it. Sometimes it's a single line — the Archimedean spiral is just \(r = a + b\theta\). Sometimes it's a stack of iterated maps in three dimensions. Most fractal apps hide that math behind sliders and presets. Math Mode opts you into seeing it.
The mode is built around two ideas. First: the formula on screen should always reflect the picture on screen. Move a slider, the values move with it. Second: the math should be readable by a curious non-mathematician — short summary first, then the long-form explainer, with a "did you know" fact at the bottom of every page. It's the format you'd want in a classroom, and the same format works for tinkering on the couch.
What you'll get out of it
- In a classroom, pick any of the 27 fractals (or the new scopes), project the canvas, and walk students through what the equation means by moving the sliders — the values update as you go. The on-screen math is the same math you'd write on the board, evaluated in real time with whatever the class picked for its parameters.
- As a hobbyist, stop guessing what a knob does. Math Mode gives every slider a label, a symbol, a current value, and a one-line plain-English description of how it shapes the figure. The textbook moment is one click away.
- Either way, it's optional. Off by default, on when you ask for it, off again when you don't.
How to turn it on
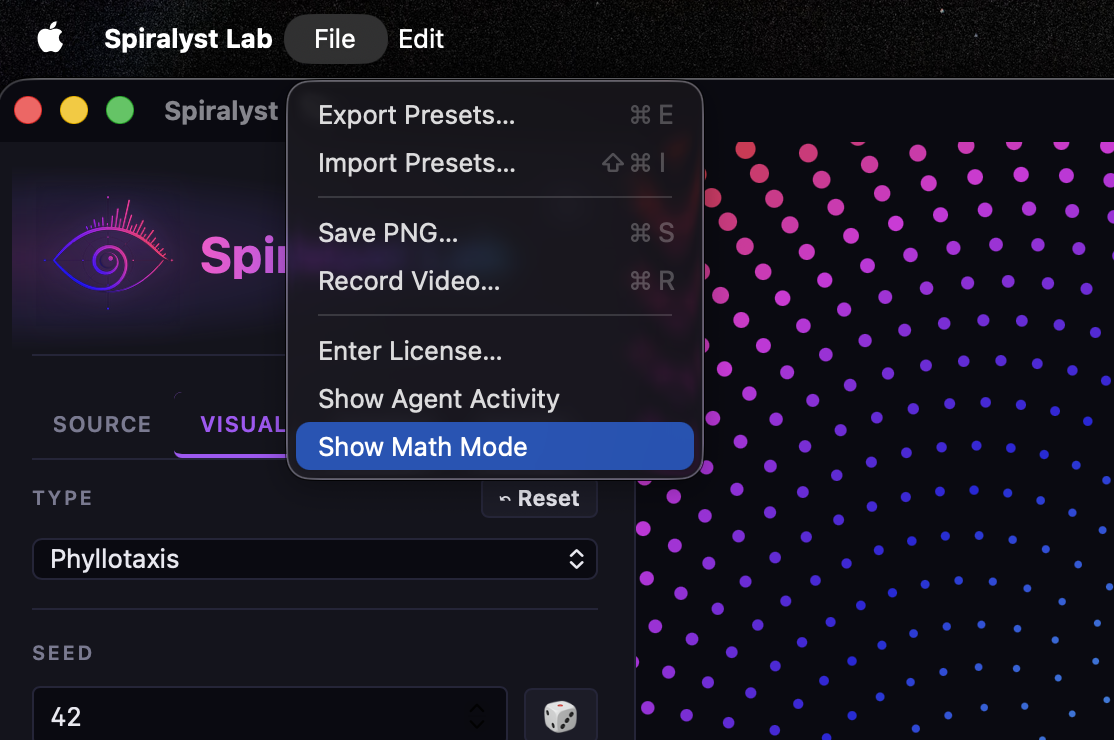
- Open the File menu in Spiralyst Lab.
- Click Show Math Mode (near the bottom of the menu, beneath Show Agent Activity).
- A purple-bordered tile appears in the top-right corner of the canvas. That's the compact formula tile, and Math Mode is now on.
- To hide it, click the menu item again.
The compact formula tile
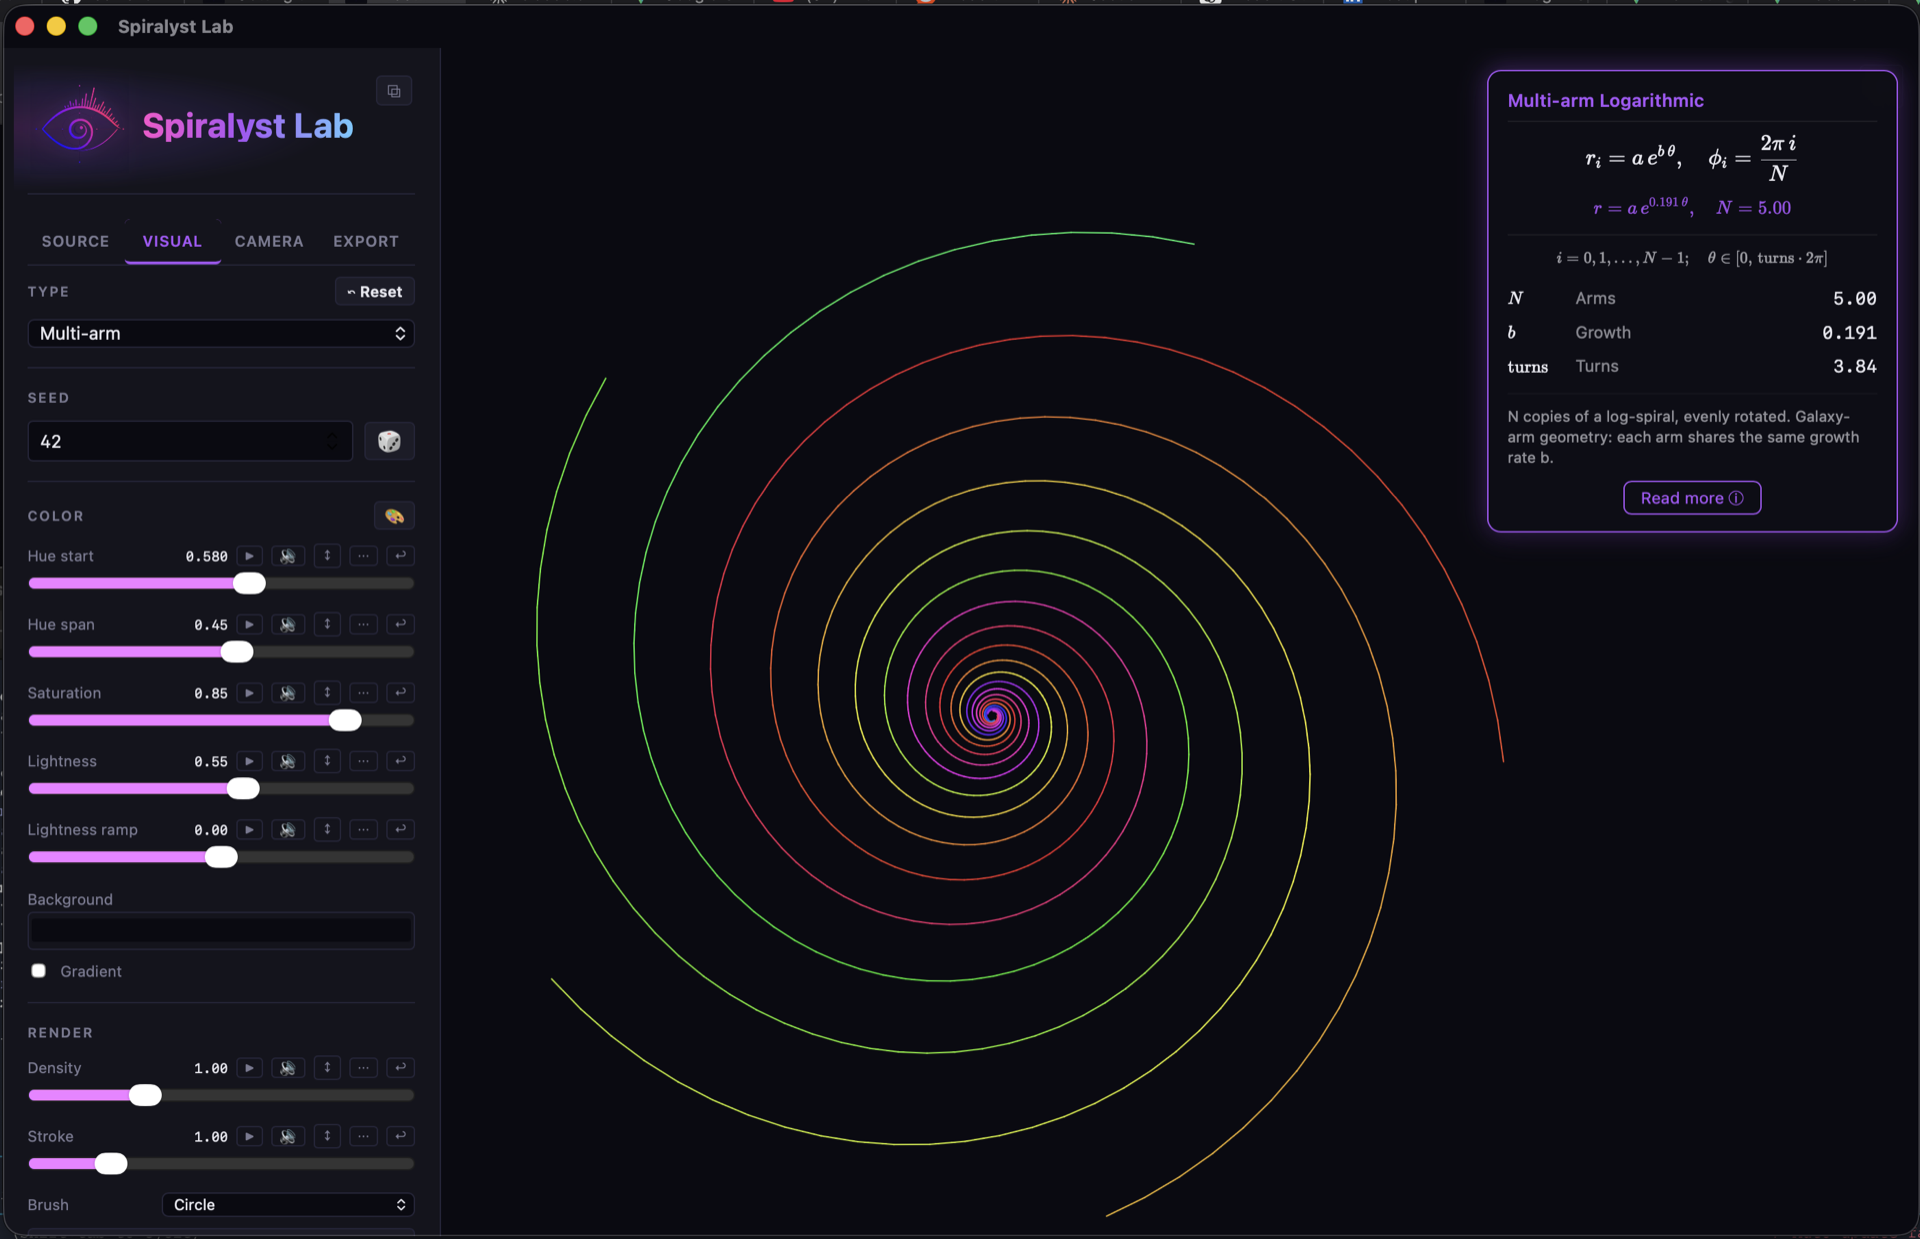
The tile is small and out of the way, and it shows you four things at once:
- The fractal's primary formula in proper mathematical notation, typeset the way a textbook would render it.
- The evaluated form underneath, in purple, with your current slider values plugged in. As you move the sidebar sliders, this line updates with you.
- A row for each symbol that appears in the formula. Each row shows the symbol's glyph (like \(N\), \(b\), \(\theta\)), its plain-English name (Arms, Growth, Turns), and its current value.
- A short plain-language description of what the formula is saying — the same line you'd find on the gallery page for that fractal.
At the bottom of the tile is a Read more button. That's where the explainer lives.
Read more — the full explainer
Click Read more on the tile and a scrollable panel slides in over the canvas. The fractal is still rendering behind the prose — you can see it breathing faintly through the panel. The panel uses the same structure for every fractal:
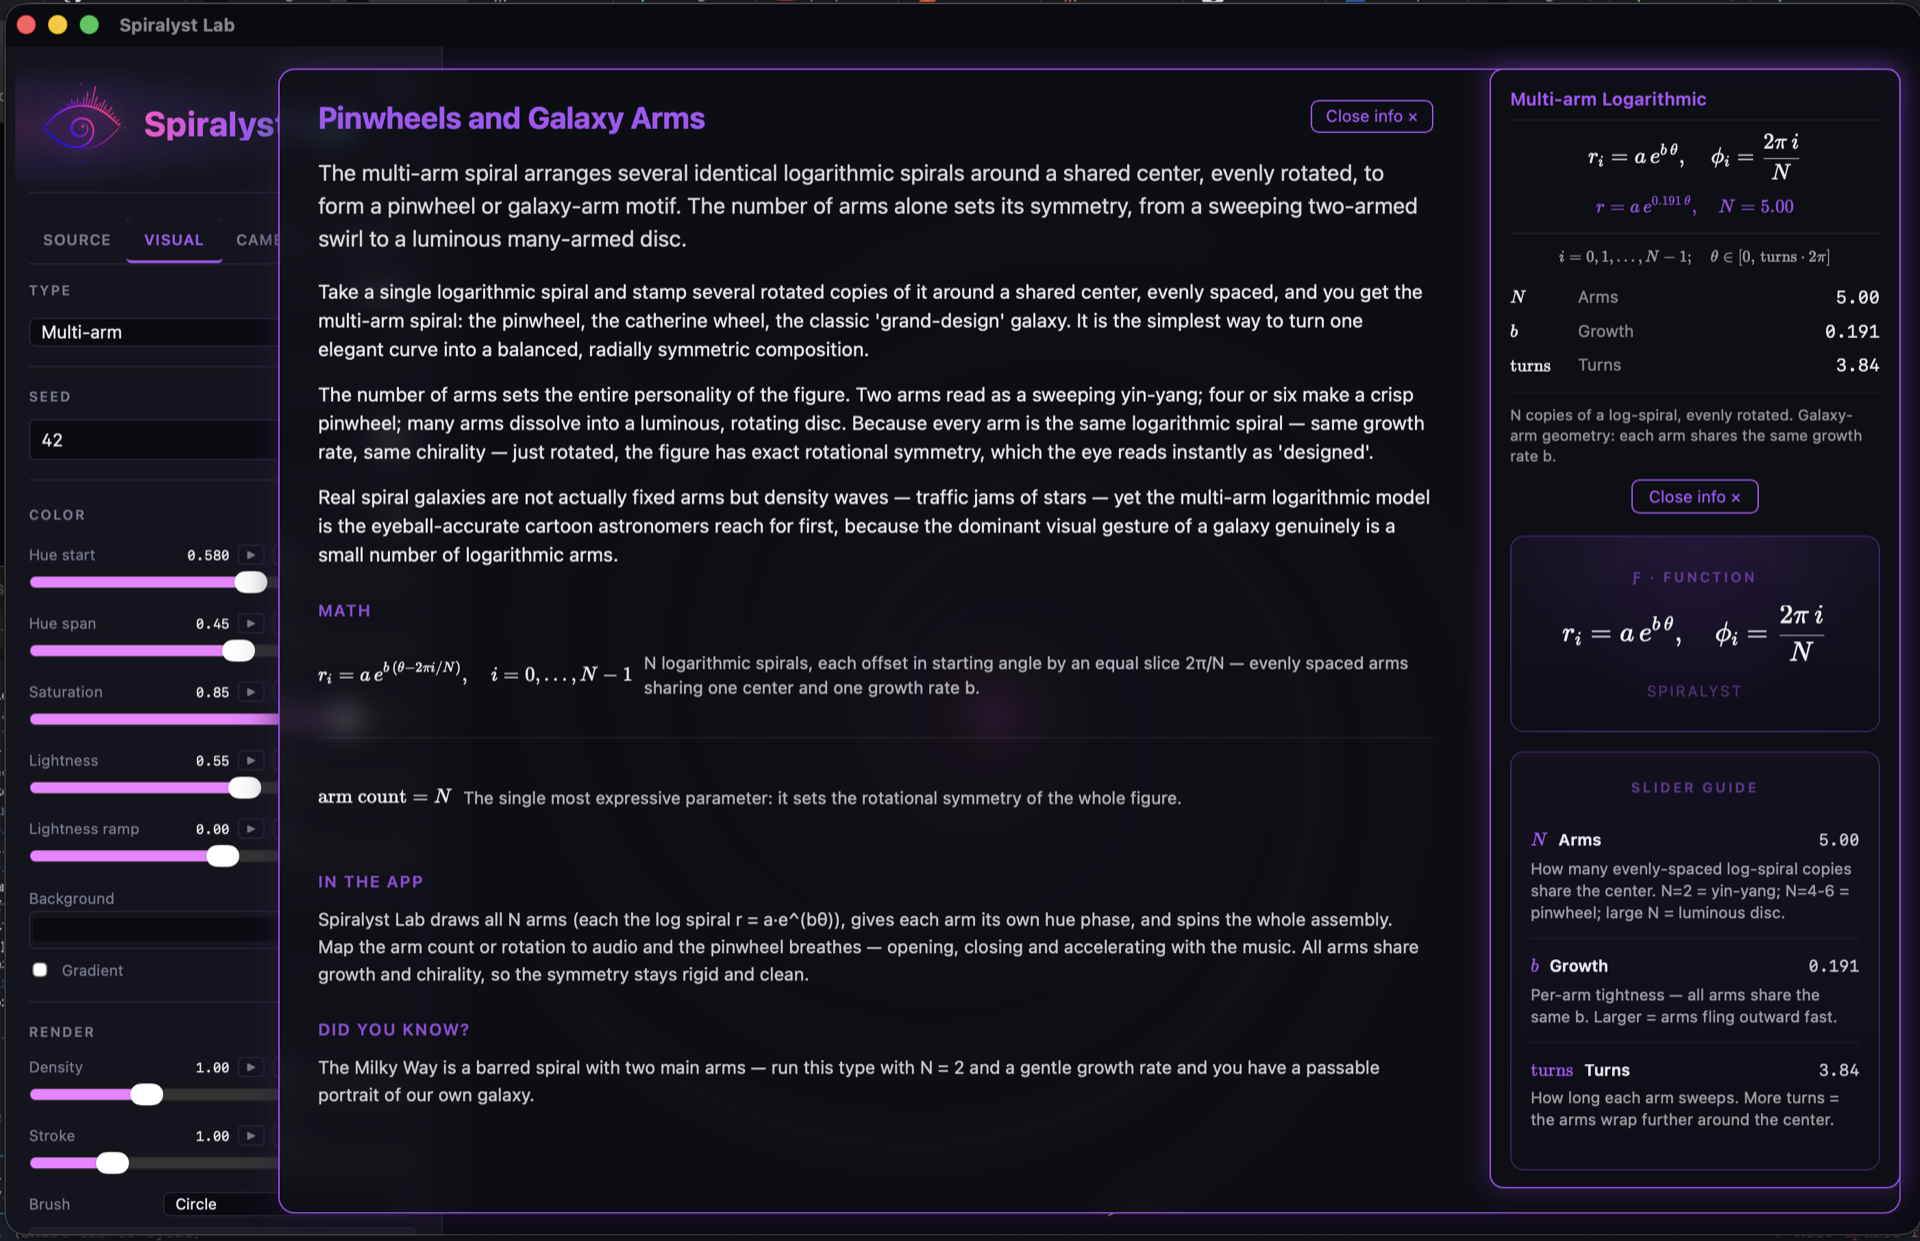
- The title — every fractal has a long-form title (the Multi-arm Logarithmic spiral is also "Pinwheels and Galaxy Arms"). The long title is what you see here.
- A short summary paragraph — one or two sentences that frame what kind of fractal this is and where you've seen it before in the world.
- Three long-form paragraphs — the narrative explainer. Plain English, with a math sentence dropped in where it helps, written so that a curious student can read it without a textbook open next to them.
- Math — the supplementary formulas for that fractal, each one with a plain-text note that says what the formula means in everyday language.
- In the app — a paragraph that names the actual sliders you'd move in Spiralyst Lab to get the look you're reading about. This is the bridge between "what the math says" and "where the controls are."
- Did you know? — a short fact at the bottom. Sometimes it's history (the Apollonian gasket is named for a Greek geometer). Sometimes it's biology (the phyllotaxis spirals in a sunflower head match the math of the fractal-phyllotaxis type). Sometimes it's astronomy (the Milky Way is a barred spiral with two main arms — run the multi-arm type with \(N = 2\) and you have a passable portrait of our own galaxy).
On the right side of the canvas while the panel is open, the formula tile extends downward into the right gutter with two more pieces:
- Hero formula — the primary equation, rendered large, brand-styled. Good for a screenshot, good for a board.
- Slider guide — one row per user-facing slider, with the symbol, the name, the current value, and a one-line explanation of what moving that slider does to the figure.
Dismissing the explainer
Three ways to close the explainer panel:
- Click the Close info × button in the top-right of the panel.
- Press ESC on the keyboard.
- Click anywhere outside the panel and outside the formula tile.
Closing the panel collapses the tile back to compact mode. The tile stays visible — Math Mode itself is still on. To hide the tile, toggle Math Mode off from the File menu.
Every type is covered — fractals and scopes
Math Mode is shipped for every render type Spiralyst Lab draws — 27 fractals (14 in 2D and 13 in 3D) plus the 4 audio visualizers in the new Scopes group.
2D types (14): Archimedean spiral · logarithmic spiral · Fermat spiral · hyperbolic spiral · phyllotaxis · rose · multi-arm spiral · fractal phyllotaxis · fractal rose · Pythagoras tree · recursive log-spiral · Apollonian gasket · SVG fractal · Julia set.
3D types (13): Mandelbulb · Mandelbox · Menger sponge · quaternion Julia · KIFS tetra · KIFS octa · KIFS cube · pseudo-Kleinian · Sierpinski tetrahedron · 3D Apollonian · TPMS Schwarz · TPMS gyroid · hybrid bulb-box.
Scopes (4): oscilloscope · Lissajous (X-Y vectorscope) · spectrum · harmonograph. See the Scopes feature page for the per-mode walkthrough.
Each type has the same shape: compact tile, info card, hero formula, slider guide. The 3D types include the parameters that actually shape the figure (power, iterations, bailout); the ray-march tuning knobs are deliberately not in Math Mode — they're rendering choices, not mathematics. The scopes carry their own per-mode formulas — the time-domain signal for the oscilloscope, the L vs R plot for the Lissajous, the discrete Fourier transform for the spectrum, and the damped-sinusoid pair for the harmonograph.
Use it in a classroom
A few starting points for educators.
Middle school — symmetry and rotation. Open the multi-arm spiral with \(N = 2\). Show students the two-armed pinwheel. Now move \(N\) up: three arms, four arms, six. Each value gives a different rotational symmetry. The number of arms is the order of rotational symmetry — a tangible introduction to a concept that's usually drawn on graph paper.
High school — exponential growth. Open the logarithmic spiral. The primary parameter is the growth rate \(b\). Set \(b\) small and the arms wind tightly around the centre; set it large and they fling outward. Math Mode shows $$r = a \cdot e^{b\theta}$$ live, so students see exactly which symbol they just moved.
High school — complex numbers. Open the Julia set. Move the real and imaginary parts of the seed \(c\) and watch the figure morph between disconnected dust, snowflakes, and connected fractal coastlines. The "did you know" fact mentions that the boundary between connected and disconnected is the Mandelbrot set — a natural lead-in to a Mandelbrot lecture.
College — iterated function systems. Open any of the three KIFS types (tetra, octa, cube). Math Mode shows the symmetry group and the fold-and-rotate transform being applied each iteration. Walking a class through one iteration step at a time, then letting it run to convergence, gives a visceral sense of attractor.
Botany class crossover — phyllotaxis. The phyllotaxis type spirals out from the centre using the golden angle (\(\approx 137.5°\)). Did you know? It's the same angle a real sunflower uses to pack its seeds. The math and the biology are the same diagram.
In every case, the workflow is the same: pick a fractal, project the canvas, turn on Math Mode, click Read more, and step the class through the explainer with the live values changing as you move sliders.
Use it as a hobbyist
If you're tuning fractals for fun rather than for a class, Math Mode answers the question that comes up every five minutes: "what does this knob actually do?"
- Hover over a slider in the sidebar. Look at the tile in the corner. The current value of the symbol that slider drives is shown there, with a short description of how it affects the figure.
- Move the slider. The tile's purple line — the evaluated form — moves with it. You're watching the math evaluate in real time.
- Wire any slider to your music (set its mode to audio in the sidebar) and the purple line in the tile breathes with the song. The math reacts to the room.
When something looks good, click Read more on the tile. The full explainer tells you why what you're seeing looks the way it does. Snapshot the hero formula card if you want a clean screenshot for a sketchbook.
Privacy and offline use
Math Mode works exactly the same whether you're online or offline. The math typesetting, the prose explainers, and the toggle state all live on your Mac — there's no network call, no telemetry, no account, no tracker. Turning Math Mode on doesn't change what data Spiralyst Lab collects, because Spiralyst Lab doesn't collect data. (Read the privacy promise for the rest of the story.)
Where to go from here
- Browse the gallery — each of the 27 fractals has a page on this site with the same prose Math Mode draws on. If you want to read the explainer without opening the app, that's where to start.
- Read the Math Mode release post for the launch announcement and a couple of in-context screenshots.
- Get Spiralyst Lab if you don't have it yet — $24.99 for a one-year license, direct download. Math Mode is included.
Get Spiralyst Lab — $24.99/yr ← Back to Support
Math typesetting on this page is rendered by KaTeX 0.17.0 (MIT).